SYNERGY BILLINGORIGINAL FQHC RESEARCH / OCTOBER 2026

National Financial Research

The FQHC Benchmark Report.

How Does Your FQHC Compare?

No Margin. No Mission.

What do 1,139 health centers reveal about financial sustainability, revenue realization, and the capacity to protect every dollar? Explore what the national numbers mean for FQHC leadership.

See What's Inside

Download Your Complimentary Report

National findings, relevant comparisons, and executive insights.

No patient information required. Immediate PDF access after submission.

Thank you! Your report is downloading now.

Preparing your download…

Download the Report (PDF)

Want to know what's behind your own numbers? Request a Complimentary Revenue Cycle Analysis
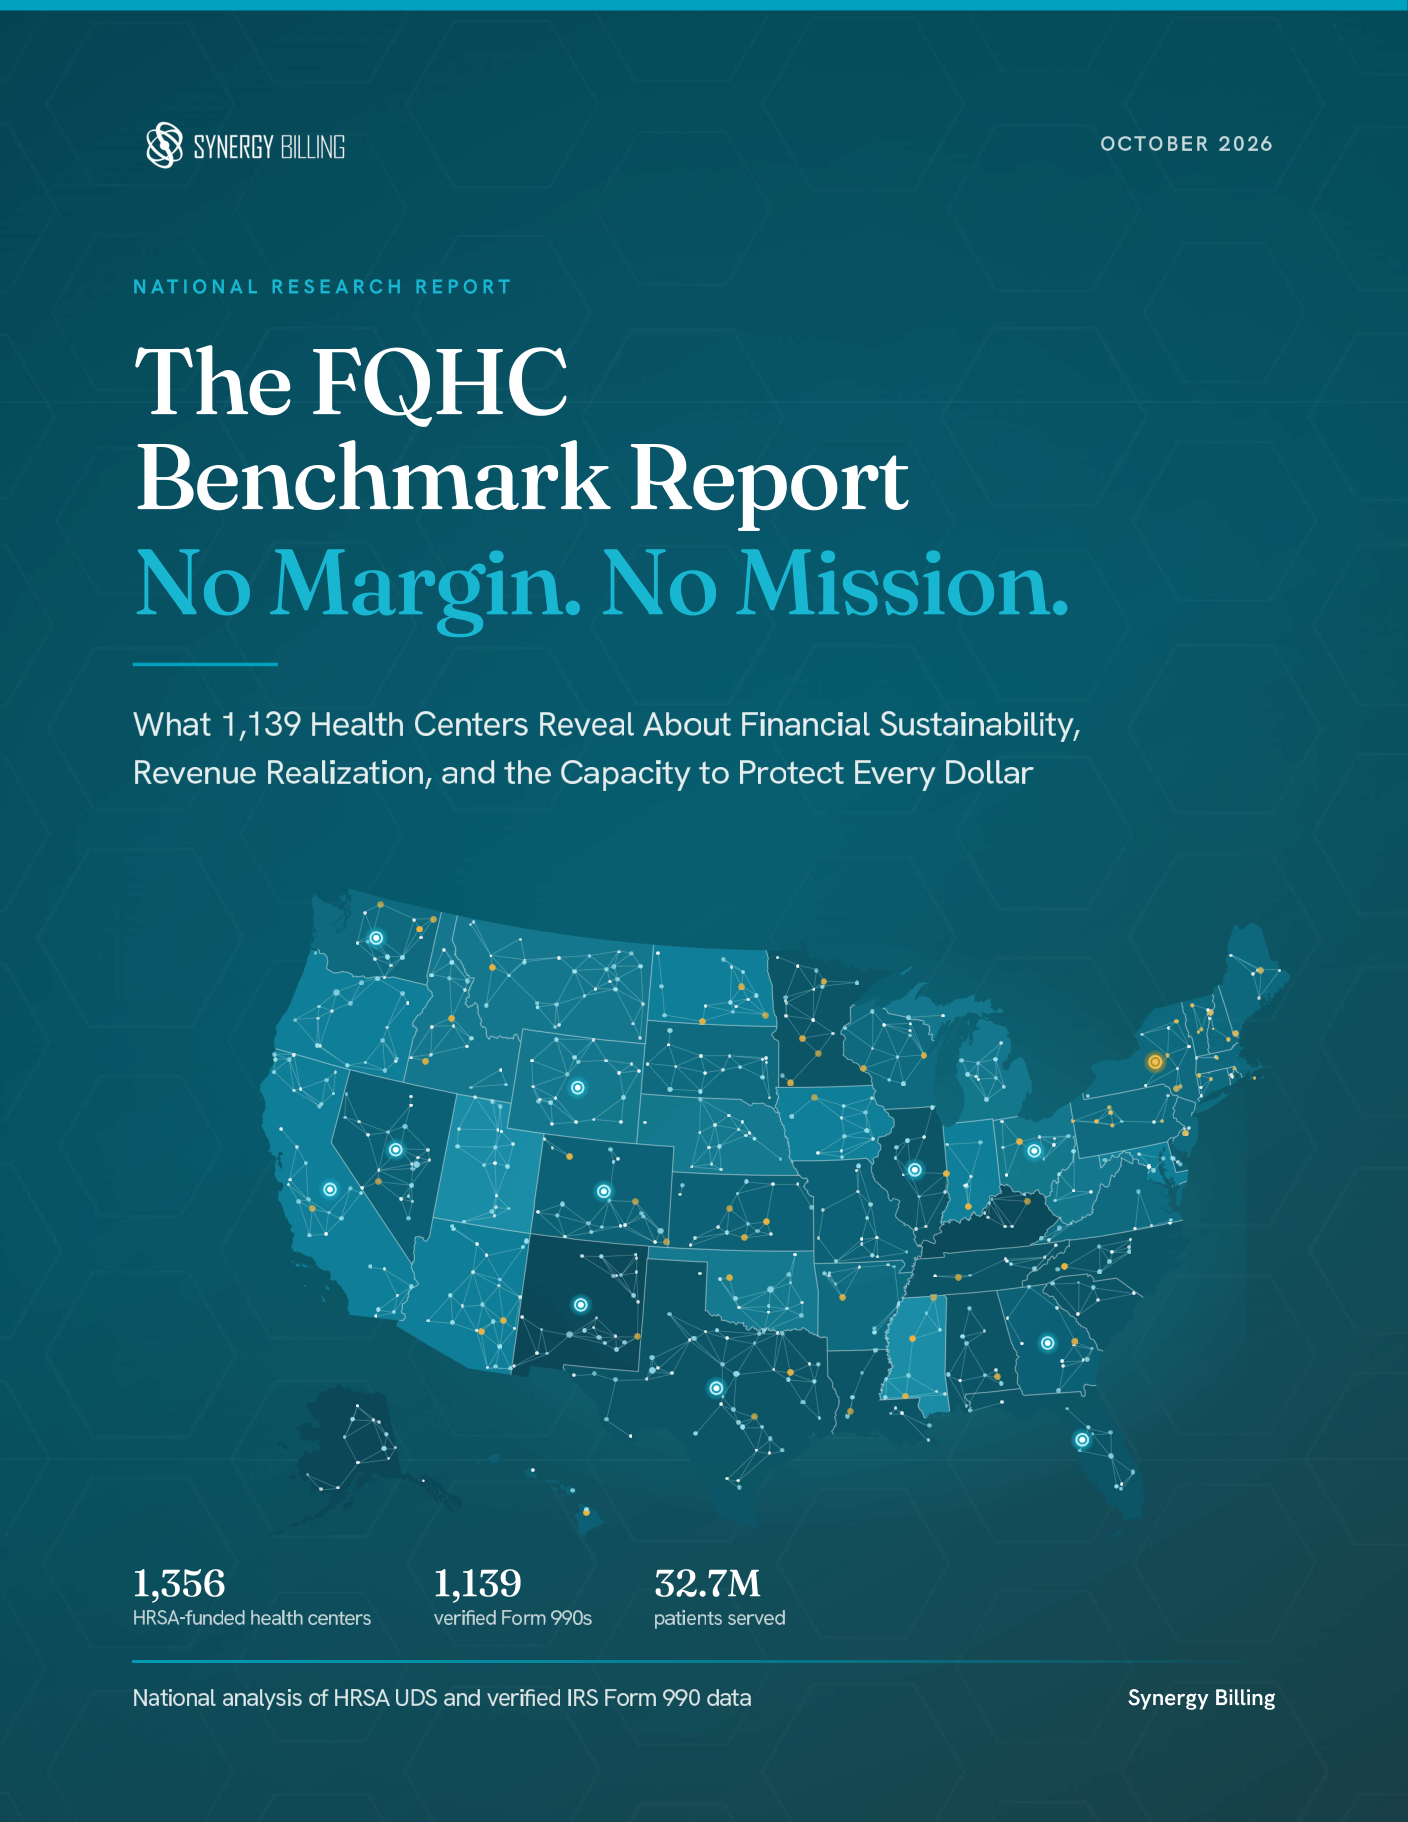
Cover of The FQHC Benchmark Report, October 2026, by Synergy Billing
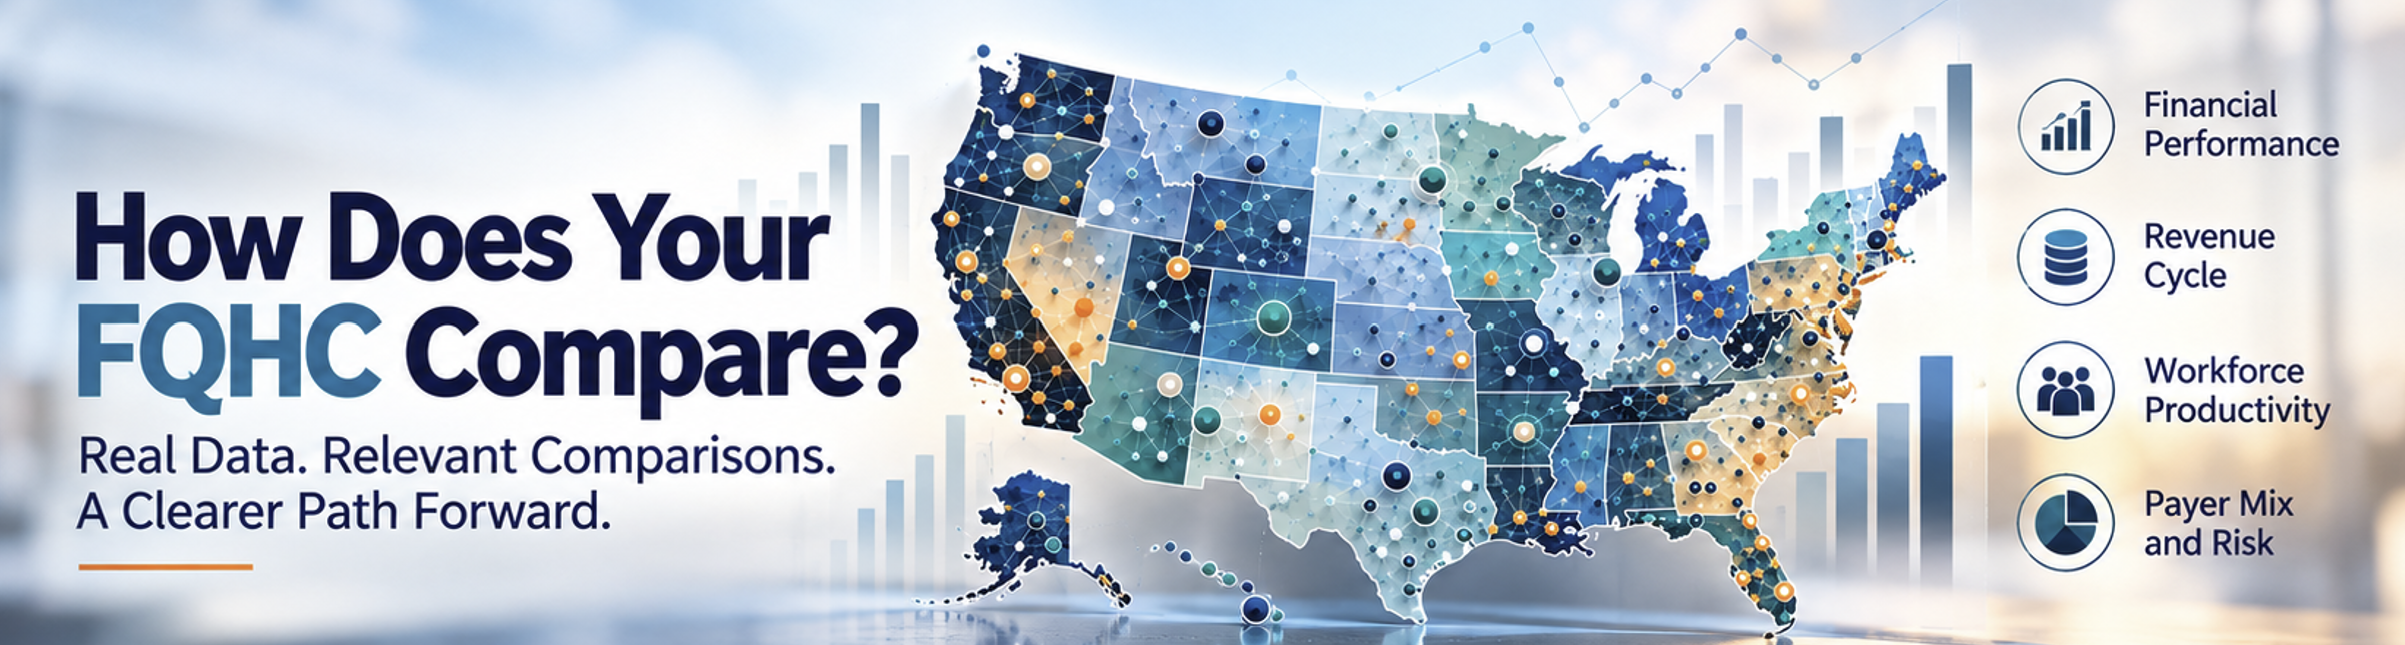
How does your FQHC compare? Real data. Relevant comparisons. A clearer path forward. Financial performance, revenue cycle, workforce productivity, payer mix and risk.

Executive Summary

The Financial Reality Is Hard to Ignore.

Nearly half of eligible health centers reported operating losses. When margins are this thin, even small setbacks change the decisions leaders face.

0.6%
Median operating margin
45.9%
Reported operating losses
168
Operating losses and fewer than 30 reported days cash

Operating margin: 1,139 eligible verified Form 990s. The reported-cash measure is a public-data proxy, not unrestricted liquidity.

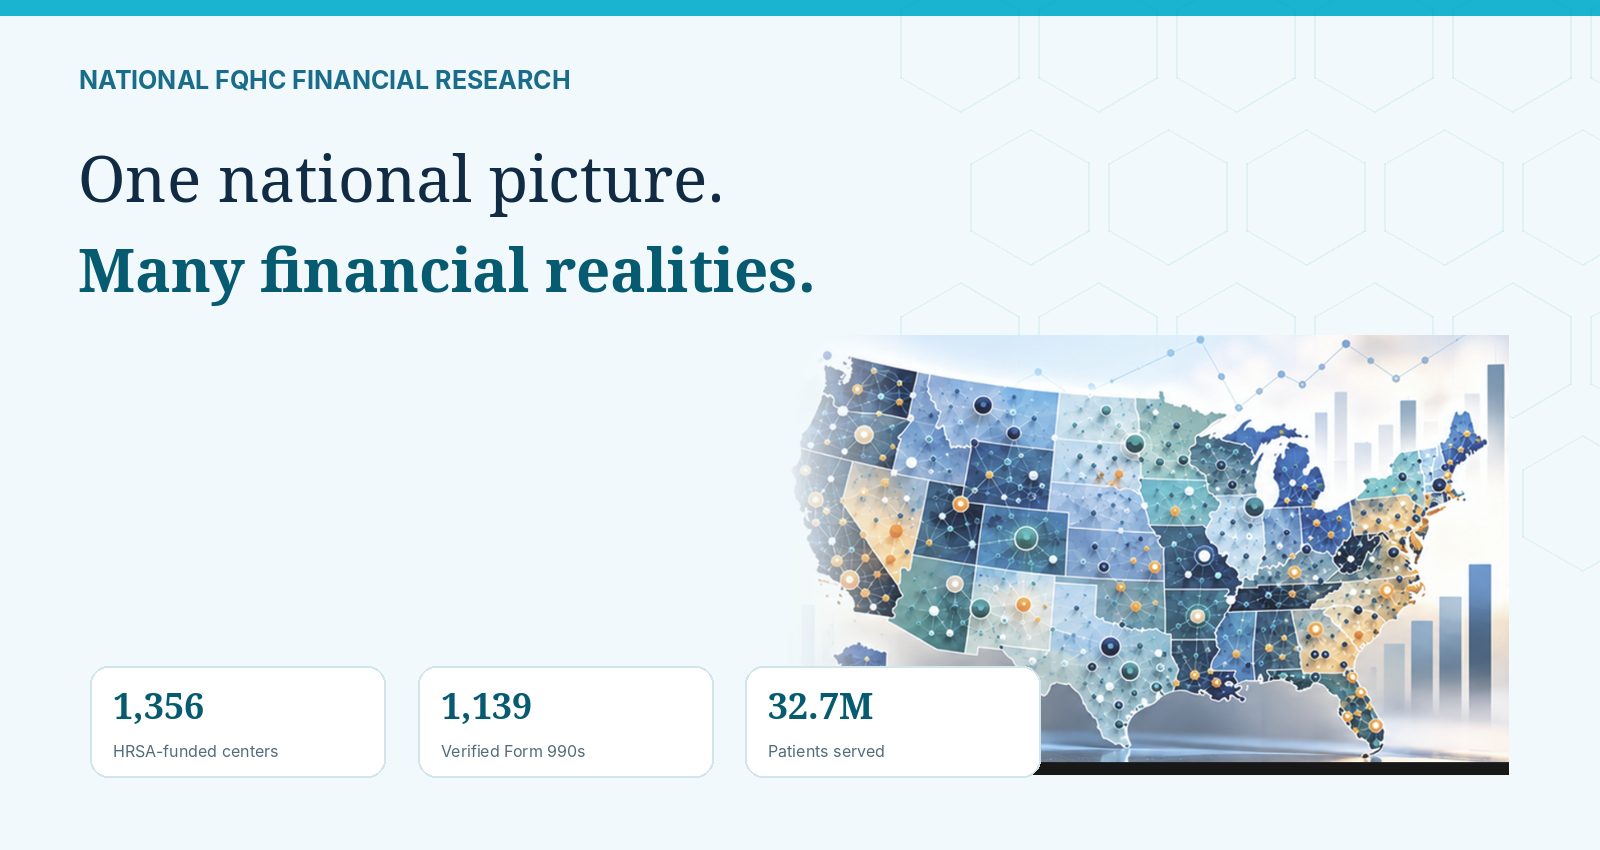
National FQHC financial research: one national picture, many financial realities. 1,356 HRSA-funded centers, 1,139 verified Form 990s, 32.7M patients served.

Synergy assembled HRSA UDS data and verified IRS Form 990 filings to examine how financial performance varies by region, organizational size, and peer group.

Inside the Report

Seven Questions Worth Exploring.

A preview of the evidence and issues covered in the full publication.

01 / Financial performance

A Positive Bottom Line Can Hide an Operating Loss.

Sixty-two health centers reported positive total margins while losing money on operations.

Does your bottom line tell the whole story?

01 | Inside the report

A positive bottom line
can hide operating losses.

Operating margin vs. total margin

612Positive on both
62Operating loss, total surplus
4Operating surplus, total loss
461Loss on both

Based on 1,139 centers with verified comparable Form 990 records.

02 / Stronger-margin centers

Better Margins Don't Always Mean Lower Costs.

Explore how patient revenue coverage, expenses, and operating margins relate across peer groups.

What distinguishes financially stronger centers?

02 | Inside the report

Better margins are not
simply about lower costs.

Compare the measures that influence financial sustainability.

Operating marginHow revenue relates to operating cost
Patient revenue coverageHow services support operating cost
Cost per patientOperating expense and service context

03 / Financial resilience

Margin Measures Performance. Cash Provides Breathing Room.

Our research identified 168 centers with an operating loss and fewer than 30 reported days cash.

How resilient is your financial position?

03 | Inside the report

Margin is performance.
Cash is breathing room.

A combined view of operating results and reported cash.

Operating lossmore cash
Operating surplusmore cash
168Operating loss + <30 reported days cash
Operating surplusless cash

Public data cash proxy; not a measure of unrestricted liquidity.

04 / Revenue realization

More Than Billed Visits. Paid Visits.

The median reporting center received $63.52 for every $100 billed across all payers.

Does your collection report tell the full story?

04 | Inside the report

Billed charges are not
the same as payments.

Median dollars received per $100 billed

$63.52All payersCenter-level median
Medicaid
$82.71
Medicare
$55.81
Private insurance
$50.57

These ratios do not measure unpaid reimbursement or revenue that is legitimately owed.

05 / Claims intelligence

Not Every Claim Issue Appears on a Dashboard.

Denials, underpayments, and adjustments sometimes require claim-level investigation.

What can disappear from A/R without being resolved?

05 | Inside the report

Not every claim issue
appears on a dashboard.

A closer review separates unresolved balances from legitimate write-offs.

  1. 1Claim submitted
  2. 2Payer response
  3. 3Review denial
  4. 4Verify adjustment
  5. 5Resolve and record

Review establishes whether additional reimbursement may be owed and reasonably collectable.

06 / No Claim Left Behind

Your Team Can't Work What It Doesn't Have Time to Reach.

New claims compete with older denials and unresolved balances for limited staff capacity.

Do you have enough capacity to follow through?

06 | Inside the report

No Claim Left Behind.
Capacity is a strategic decision.

A billing department has finite time. Unresolved claims still need a decision.

01Hire and trainBuild internal capacity
02Redesign workflowsPrioritize exceptions
03Augment the teamAdd FQHC specialists

07 / Revenue cycle value

Knowing Your Numbers Is Only the Beginning.

Public benchmarks reveal patterns. Your own claims and payments reveal your circumstances.

How much of your A/R is realistically collectable?

07 | Inside the report

National benchmarks
start the conversation.

Question 01

How much A/R is
realistically collectable?

Question 02

How much patient service
revenue should we receive?

Research for FQHC leadership

How Does Your FQHC Compare?

Bring better questions to your next executive or board discussion. Read the full national Benchmark Report.

Download the FQHC Benchmark Report

Complimentary research. No obligation.

Thank you! Your report is downloading now.

Preparing your download…

Download the Report (PDF)

Want to know what's behind your own numbers? Request a Complimentary Revenue Cycle Analysis
Insights for FQHCs  

Explore articles that examine individual findings, challenge conventional performance measures,

and translate the research into practical leadership questions.


Articles

How does your FQHC compare? What the financial data tells us about community health centers


What 1,139 Health Centers Reveal About FQHC Financial Sustainability


Frequently Asked Questions

What is included in the report?

National and regional financial findings, operating and total margins, reported liquidity, revenue realization, selected peer comparisons, staffing and productivity perspectives, and methodology notes.

Where does the information come from?

HRSA UDS data and verified IRS Form 990 financial records. The research covers 1,356 HRSA-funded centers, including 1,139 with verified comparable financial filings. Eligible reporting populations vary by measure.

How are health centers compared?

The report explores national, regional, patient-volume, and selected peer group comparisons, with research limitations described.

Will I receive my individual FQHC scorecard?

No. This download is the national research report. It does not instantly produce an individual center scorecard.

Does a weak benchmark mean our billing is underperforming?

No. Public comparisons cannot establish the cause of a financial difference or determine underpayments for an individual center.

Is there a cost or obligation?

No. The report is complimentary and requires no services engagement.

How does this differ from a Revenue Cycle Analysis?

The Benchmark Report analyzes public data across health centers. A separate Complimentary Revenue Cycle Analysis reviews your organization's own claims, payments, adjustments, denials, and A/R to investigate specific reimbursement questions.
Synergy Billing · Stress-free RCM Specifically for FQHCs © 2026 Synergy Billing