Financial Resilience
Operating margin, total margin, days cash, net asset growth, and balance sheet strength.

THE FQHC BENCHMARK | NO MARGIN. NO MISSION.
Drawing on financial and operational data from more than 1,300 community health centers nationwide, Synergy Billing's No Margin. No Mission. initiative reveals the trends, challenges, and opportunities shaping FQHC financial sustainability. Explore national benchmarks, state-level insights, and peer comparisons designed to help health center leaders make informed decisions, strengthen financial performance, and protect their mission.
Understand your health center's financial and operating position using available public data and a relevant peer group. Request a personalized comparison to identify differences worth discussing with your leadership team.
FQHC-exclusive expertise. A 100% U.S.-based team. More than 20 years serving community health centers.
WHAT THE NUMBERS REVEAL
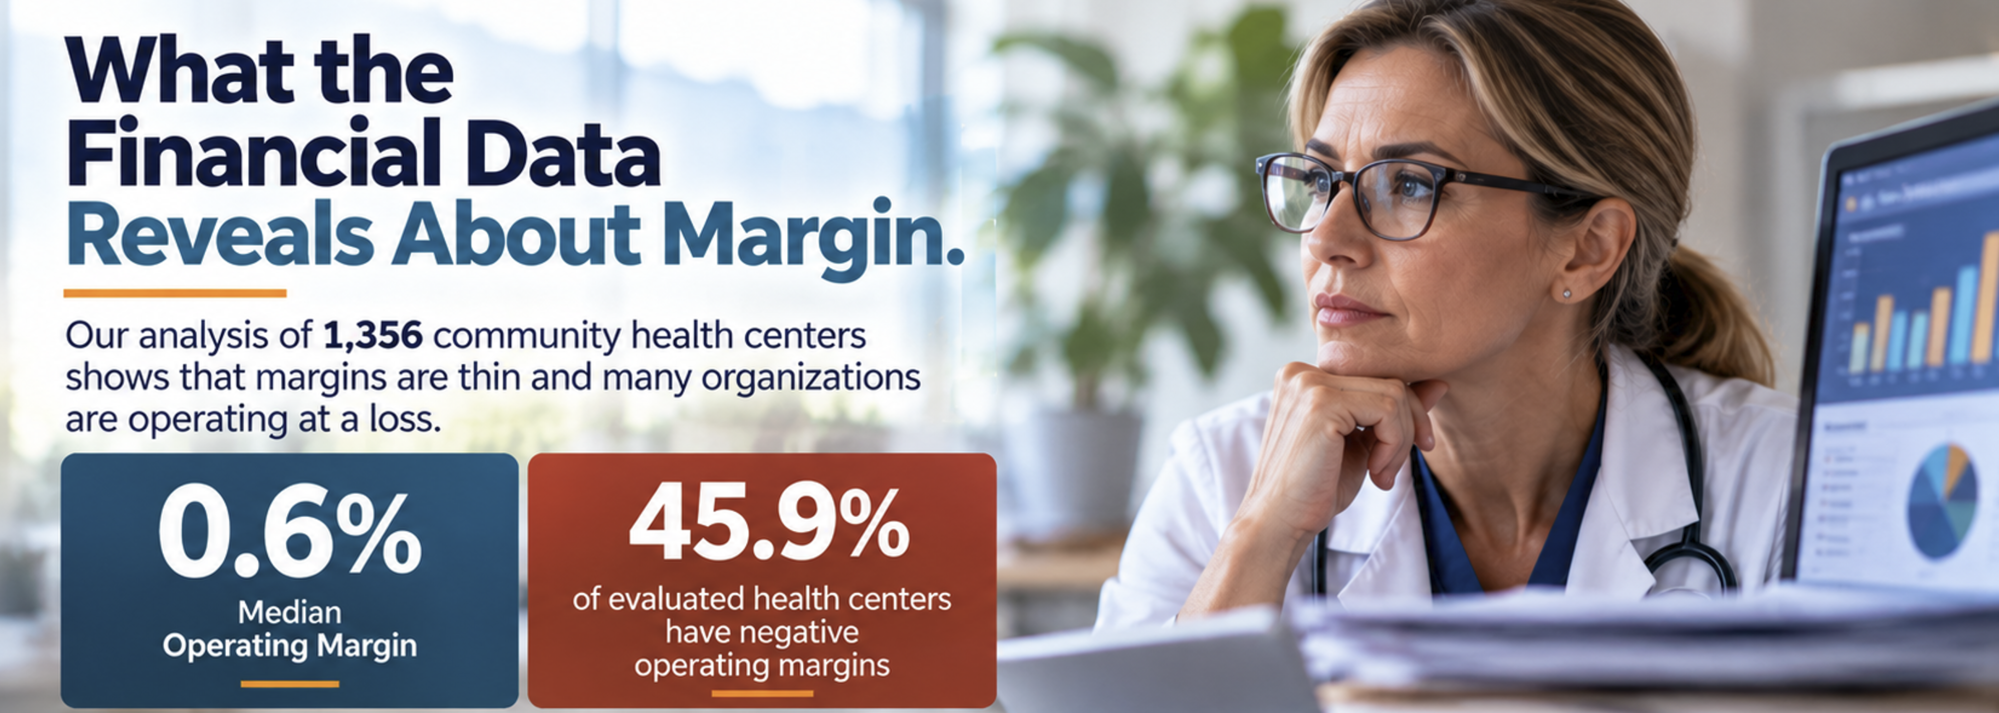
Our final report examines financial sustainability using a national research universe of 1,356 HRSA-funded health centers, including 1,139 with verified full Form 990 returns.
Source: Synergy Billing, The FQHC Benchmark Report, October 2026, pp. 3–6 and 12–14. Form 990 fiscal years ending 2023–2026, blended. Operating margin is a defined analytical measure; grants and pharmacy income, including 340B, remain included. Reported cash combines restricted and unrestricted amounts and is not unrestricted liquidity.
Median operating margin • 1,139 verified Form 990s
Reported an operating loss • 523 of 1,139 centers
Operating loss and under 30 reported days cash • 14.8% of 1,138 eligible centers
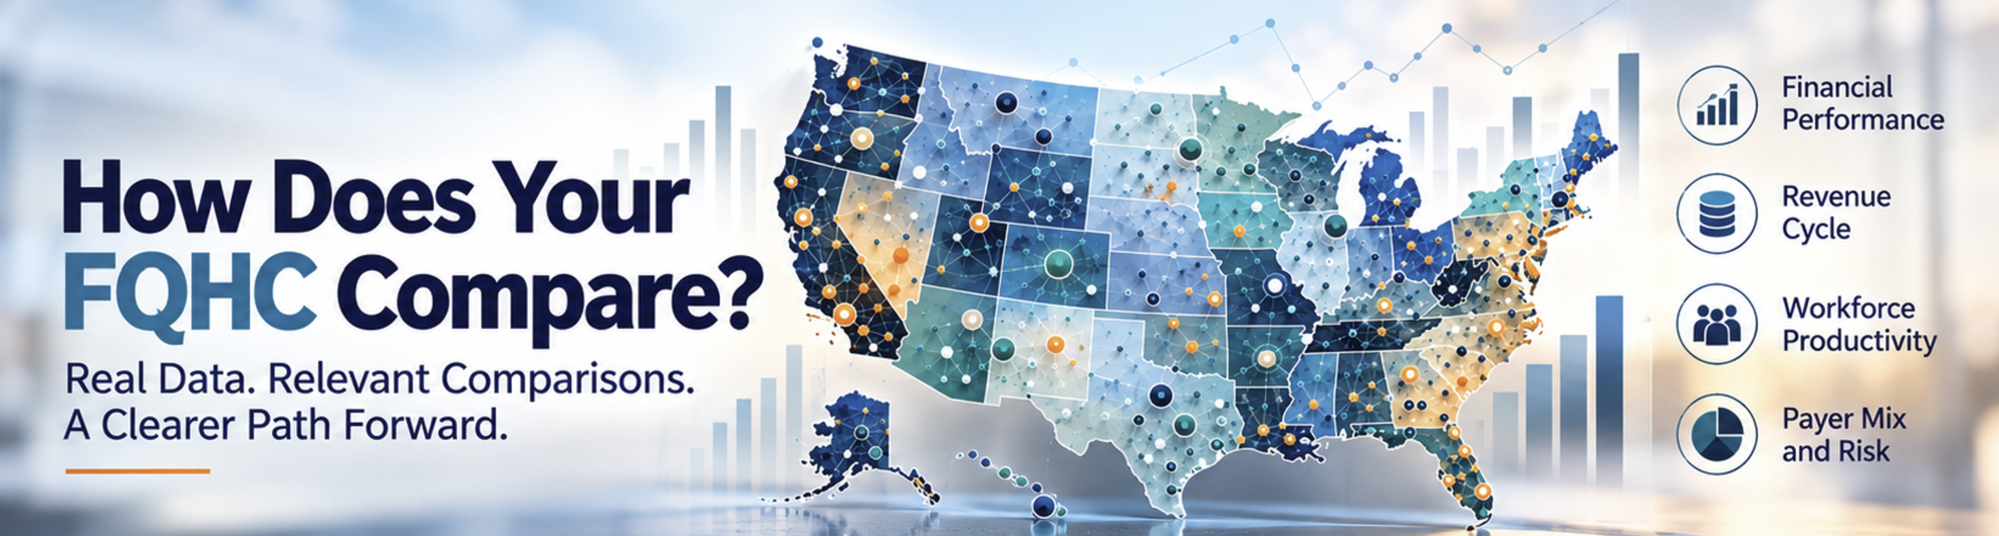
MEANINGFUL PEER COMPARISONS
Operating margin, total margin, days cash, net asset growth, and balance sheet strength.
Directional receivables comparisons and patient service revenue context, with clear limits on what public data can reveal.
Understand cost per patient, operating expense patterns, staffing, and workforce productivity among similar centers.
Examine payer mix and concentration as context for reimbursement exposure and financial stability.
YOUR HEALTH CENTER. YOUR PEER GROUP.
Tell us which health center you represent. Our team will review the available public data and prepare a comparison with a relevant peer group.
What happens next: We review data availability and the eligible comparison group, then contact you about your personalized findings. If the available data cannot support a meaningful comparison, we will explain the limitation.
No patient information is needed to submit this request. This is a prepared report, rather than an instant download.
Measures are directional. Eligibility, reporting periods, and comparison group sizes vary by measure. Public benchmarks do not establish the cause of a performance difference.
We begin with region, patient population, and urban or rural setting, then consider payer mix and funding context. Peer ranks are withheld when fewer than 10 scored peers are available. If the available data cannot support a meaningful comparison, we explain that limitation.
The October 2026 national report combines HRSA UDS information with verified full IRS Form 990 returns. The universe includes 1,356 HRSA-funded health centers; 1,139 have verified full Form 990s. Financial results blend fiscal years ending 2023–2026. Each measure has its own eligible population, source period, and calculation conventions.
No. Geography, reimbursement arrangements, patient needs, payer mix, funding, and operating choices all affect performance. Public comparisons identify questions; they do not establish cause. Reviewing claims, payments, adjustments, denials, and balances is a separate step.
A personalized comparison of your health center's available public financial and operating measures with a relevant peer group, subject to data availability. This is prepared after review, rather than delivered as an instant automated download.
The personalized public-data benchmark is complimentary. Requesting it does not commit your health center to outsourcing. If the findings suggest questions about reimbursement or collectible A/R, we can discuss a separate complimentary Revenue Cycle Analysis.
A personalized benchmark uses available public data to show where your health center stands. A Revenue Cycle Analysis uses your own claims, payments, adjustments, denials, and balances to investigate appropriate reimbursement and potentially collectible A/R. No patient information is needed to submit this initial benchmark request.
Resource Library
No Margin. No Mission.
Discover what national FQHC financial data reveals about operating margins, cash reserves, revenue realization, and financial resilience.
Explore articles that examine individual findings, challenge conventional performance measures, and translate the research into practical leadership questions.
Understand how financial conditions vary by geography, patient population, and organizational size. Explore state-specific research as it becomes available.